
Use the direct method for short-term liquidity, often implemented as a rolling model covering roughly three months, and switch to the indirect method once you’re forecasting beyond that near-term horizon. Most growing businesses end up running both: direct for near-term weeks, indirect for later months. Pick your reporting period, pull your bank, accounts receivable and accounts payable data, and start building today.
TL;DR:
- Most businesses need to use both the direct method for near-term forecasts and the indirect method for longer-range planning, often through a hybrid approach.
- The direct method provides transaction-by-transaction accuracy for the upcoming weeks, while the indirect method offers quicker, high-level insights for months or years ahead.
- Use daily or weekly cadence for immediate liquidity management, a 13-week rolling forecast for short-term cash control, and monthly or long-term models for budgeting and investor relations.
- Ensure input data such as bank feeds, accounts receivable, and payable aging are clean and reconciled to avoid forecasts drifting from actual balances.
- Reconciliation against actuals is critical before building or updating forecasts to prevent errors and ensure ongoing model accuracy.
A cashflow forecasting model is a structured way to predict how much cash moves in and out of your business over a set period, and what your bank balance looks like at the end of it. It exists to answer one question: will you have enough cash to cover what’s coming, and when might that change?
There are two established methods for building one, and choosing between them is the single most consequential decision in the whole process.
Direct forecasting tracks actual cash receipts and payments, transaction by transaction: customer receipts in, supplier payments, payroll and tax out. It’s most accurate for short horizons because it works from real transaction data rather than estimates, which makes it the natural fit for weekly or 13-week operational forecasts where precision matters more than convenience.
Indirect forecasting starts from net income and adjusts for non-cash items and changes in working capital. It’s quicker to prepare because it draws on statements you already produce, which is why most finance teams default to it for monthly and longer-range planning.
Here’s the tension worth understanding: ICAEW’s own commentary notes that the direct method is genuinely more informative, yet the indirect method dominates in practice because it reconciles cleanly to net income and demands far less administrative effort. Neither choice is wrong. They solve different problems.
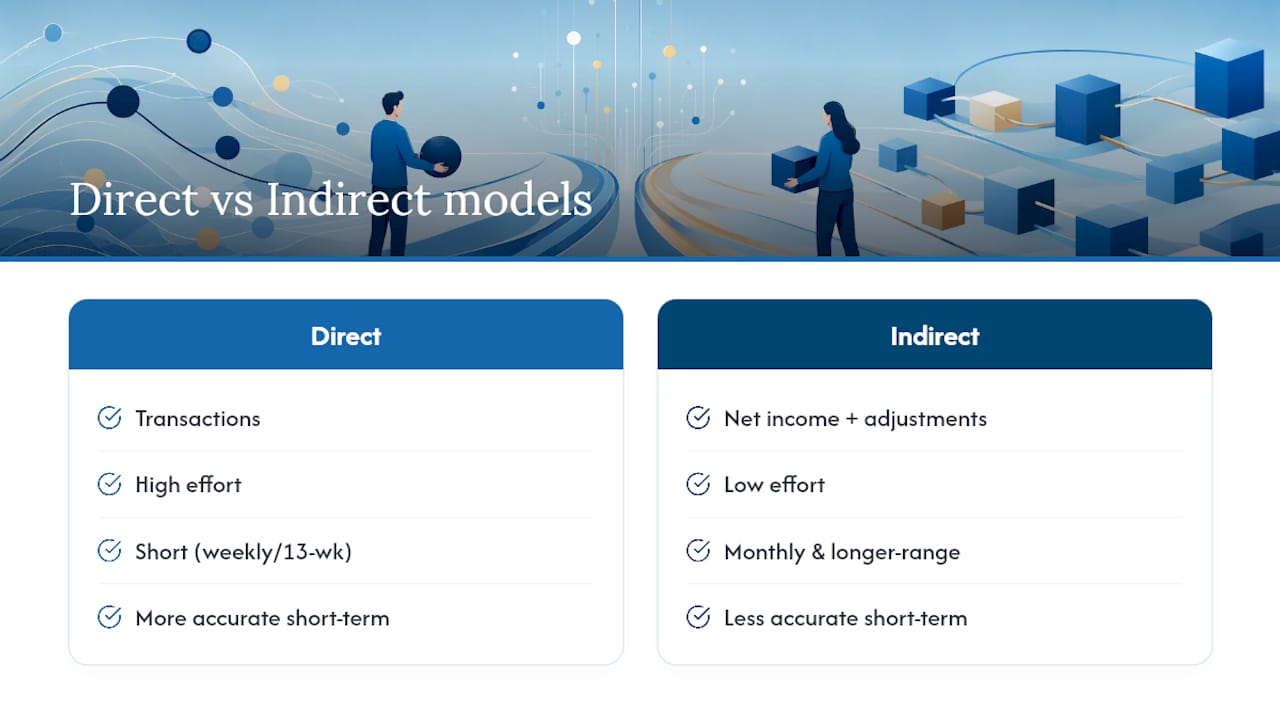
The honest answer is that most businesses need both, applied to different windows of time.
A practical selection checklist cuts through most of the indecision:
Pro Tip: Don’t force a single method across your whole forecast horizon. Run direct for the near term and indirect further out inside the same workbook, with a clear handover point where one method’s ending balance becomes the other’s opening balance.
Every credible model, whatever method you use, needs the same skeleton. Miss one of these and the forecast will drift from reality within a few weeks.
Keep inputs, processing and outputs in separate tabs or sections. It sounds like a minor structural choice, but blending raw data with formulas is the single most common reason forecasts become unmaintainable after the person who built them leaves.
The right cadence depends entirely on the decision the forecast is meant to support, and using the wrong one wastes effort in one direction or leaves you blind in the other.
None of these horizons replace the others. A business raising a Series A round needs the long-term model for investor conversations and the 13-week model to prove it can actually manage the cash it already has.
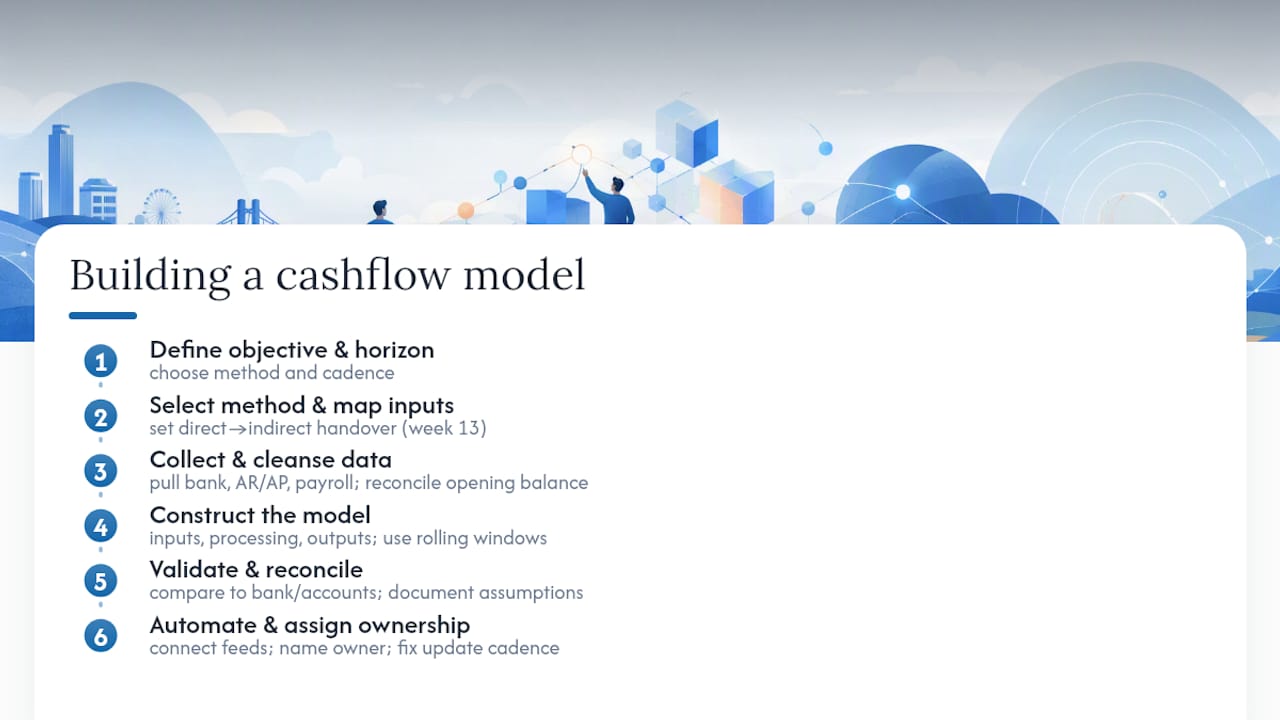
Step 1: Define the objective and horizon. Are you managing operational liquidity, planning a budget, or calculating runway for a funding conversation? Each answer points to a different method and cadence, so nail this before opening a spreadsheet.
Step 2: Select your method and map the inputs. If you’ve settled on a hybrid approach, decide exactly where the direct model hands off to the indirect one. Most businesses set that handover at week 13.
Step 3: Collect and cleanse source data. Pull bank transaction history, accounts receivable and accounts payable ageing, and your payroll schedule. This step is tedious and it’s also where most forecasting errors originate. Reconcile the opening balance to an actual bank statement before you build anything on top of it.
Step 4: Construct the model. Keep three distinct sections: inputs (raw data and assumptions), processing (the formulas that turn inputs into projected balances), and outputs (the numbers people actually read). Use rolling window formulas so each week automatically drops off the oldest period and adds a new one, rather than rebuilding the sheet manually every Friday.
Step 5: Validate and reconcile. Compare your forecast’s opening figures against actual bank statements and management accounts. Document every assumption you’ve made about payment terms or timing. A model nobody can interrogate six months later isn’t a model, it’s a guess with formatting.
Step 6: Automate and assign ownership. Connecting bank feeds and ERP data cuts most of the manual re-entry that causes both errors and abandonment. Assign one named owner, fix an update cadence (weekly for the 13-week model, monthly for the longer view), and standardise the reporting template so the output looks the same every cycle.
Pro Tip: Build the reconciliation step into your calendar before you build the forecast itself. A model that’s never checked against actuals will drift silently for months, and by the time someone notices, the numbers have stopped being useful.
A monthly template needs rows for opening balance, each major inflow category, each major outflow category, and closing balance, with one column per month across your financial year. Populate the inflow and outflow rows directly from your accounting system rather than re-typing figures. Worked examples with driver tables are the fastest way to see how ending cash and covenant headroom should actually flow through the sheet.
A 13-week rolling model swaps months for weekly columns and adds driver rows beneath each cash line, so you can see exactly which assumption is moving the total. Every week, drop the oldest column, add a new week thirteen weeks out, and refresh actuals for the week just closed.
Test both templates against a handful of scenarios before you trust them:
Track four outputs consistently: ending cash, rolling runway, any lending covenant headroom, and variance against what actually happened last period. Variance is the metric most businesses ignore, and it’s the one that tells you whether your model is actually earning its keep.
The most persistent error is including non-cash transactions in the forecast body. Equity issued for an asset, or a capital lease acquisition, involves no cash at all and should sit in a separate disclosure schedule, not in your projected balance.
Other recurring traps:
A useful benchmark: businesses that reconcile the forecast against actuals every cycle catch drift early; those that don’t often discover the problem only when the bank balance disagrees with the spreadsheet by a meaningful margin.
Over more than 40 years advising businesses, and specifically supporting tech startups and growing SMEs through funding rounds, Price & Accountants has built and reconciled cashflow models across every stage from pre-seed to Series A. A rolling 13-week model has repeatedly been the difference between spotting a collections slowdown in week three and discovering it in week nine, when options narrow fast. For founders preparing for a funding conversation, a hybrid model, direct near-term and indirect further out, tends to satisfy both operational scrutiny and investor due diligence in the same document. If you want a model built or reviewed against your own accounts, that’s a conversation worth having early.
— Rahamut
The decision usually comes down to five questions: how clean is your data, how often do you need updates, how complex are your cash flows, how sensitive is your runway to small errors, and does anyone internally have the time and skill to maintain this properly?
If the answer to most of those points towards “not really,” an outsourced finance director typically brings automated bank and accounting feeds, a reconciled rolling forecast maintained on a fixed schedule, and periodic scenario workshops that stress-test assumptions before a lender or investor does it for you. That matters most at exactly the moments when it’s hardest to do internally: mid-fundraise, mid-hiring-spree, or the month a large customer pays late. Getting this decision right shapes how confidently you walk into a lender meeting or a board update with numbers nobody has to defend on the spot.
Price & Accountants specialises in the businesses generalist accountants tend to underserve: UK tech and fintech startups from pre-seed through Series A, and founders setting up a UK entity from overseas. Where a typical bookkeeping service stops at historic accounts, our finance directorship services build and maintain the rolling forecasts investors and lenders actually ask to see.

Working with us typically means weekly 13-week forecasts kept current through automated bank feeds, models reconciled against actual accounts rather than left to drift, and monthly management packs accessible without a translation session. Our cloud accounting work runs on Xero, which keeps the data feeding your forecast current rather than a month behind. Pricing runs from the Core Services plan at £249 per month through to the Black Plan at from £1,999 per month for businesses needing full finance director support, all detailed on our pricing page. If you want a straightforward look at where your own forecast currently stands, get in touch to request a bespoke cashflow review.
For deeper detail on the standards behind these methods, ICAEW’s guidance on direct versus indirect reporting and its note on common cashflow pitfalls are both worth reading in full. For structuring your own template, the worked monthly cashflow example is a solid starting point, and our own glossary explains what counts as a cash flow in more depth.
Cashflow forecasts are generally built using the direct method, the indirect method, or a hybrid of the two, applied across different horizons: daily/weekly, 13-week rolling, monthly and long-term (one to five years). Which combination you need depends on whether you’re managing operational liquidity or planning further ahead.
The two established methods are direct forecasting, which tracks actual transaction-level receipts and payments, and indirect forecasting, which adjusts net income for non-cash items and working capital changes. Direct suits short-term operational forecasts; indirect suits monthly and longer-range planning.
A three-way forecast links the profit and loss account, balance sheet and cashflow forecast so that changes in one automatically flow through to the others, giving a fuller picture than a standalone cash forecast. It’s typically built using the indirect method, since it starts from projected net income.
A cash flow model is a structured spreadsheet or system that projects future cash inflows and outflows against an opening balance to estimate your bank position at future dates. Practical versions include the 13-week rolling model for short-term liquidity and the monthly template for budgeting and board reporting, and Price & Accountants builds both as part of its finance director support.