
Check three numbers before anything else: your LTV:CAC ratio, your CAC payback period, and your gross margin. If your LTV:CAC sits near or above 3:1, payback lands within a commonly accepted healthy range, and gross margin clears 70%, your growth is very likely sustainable. Fall short on two of three, and no amount of top-line growth will save the business from a cash crunch.
TL;DR:
- Fully loaded CAC should include sales salaries, onboarding costs, and trial infrastructure, not just advertising expenses, to accurately reflect true customer acquisition costs.
- An LTV:CAC ratio above 3:1 is ideal, but it can fall to around 3.34:1 when fully loaded CAC is considered, which still indicates healthy unit economics.
- CAC payback periods within 12 months are ideal; longer periods, such as 15 months, may be acceptable if customer retention and NRR are high enough to justify the investment.
- Cohort analysis reveals hidden efficiencies or inefficiencies by segmenting customers by acquisition channel, size, or profile, instead of relying solely on blended metrics.
- For early-stage SaaS, a lower LTV:CAC ratio and longer payback are common, but later stages require higher ratios and shorter payback periods to demonstrate sustainable growth.
The “unit” in unit economics for SaaS is usually a single customer, though some businesses track it per seat licence, per API call, or per active user when that maps better to how revenue actually scales. A per-seat model needs seat-level economics. A usage-based product needs the unit to reflect consumption, not headcount. Get this wrong and every metric downstream is distorted.
Seven metrics form the core framework, and each answers a different question about the business.
The distinction between logo churn and revenue churn trips up more founders than any other metric on this list. A SaaS company can report flat logo churn while revenue churn quietly climbs, because the customers leaving are increasingly the valuable ones. NRR catches this. It’s why investors increasingly treat NRR as more diagnostic than gross churn alone, especially past Series A when expansion revenue should be doing real work.
The formulas are straightforward. The trouble is what founders leave out of them.
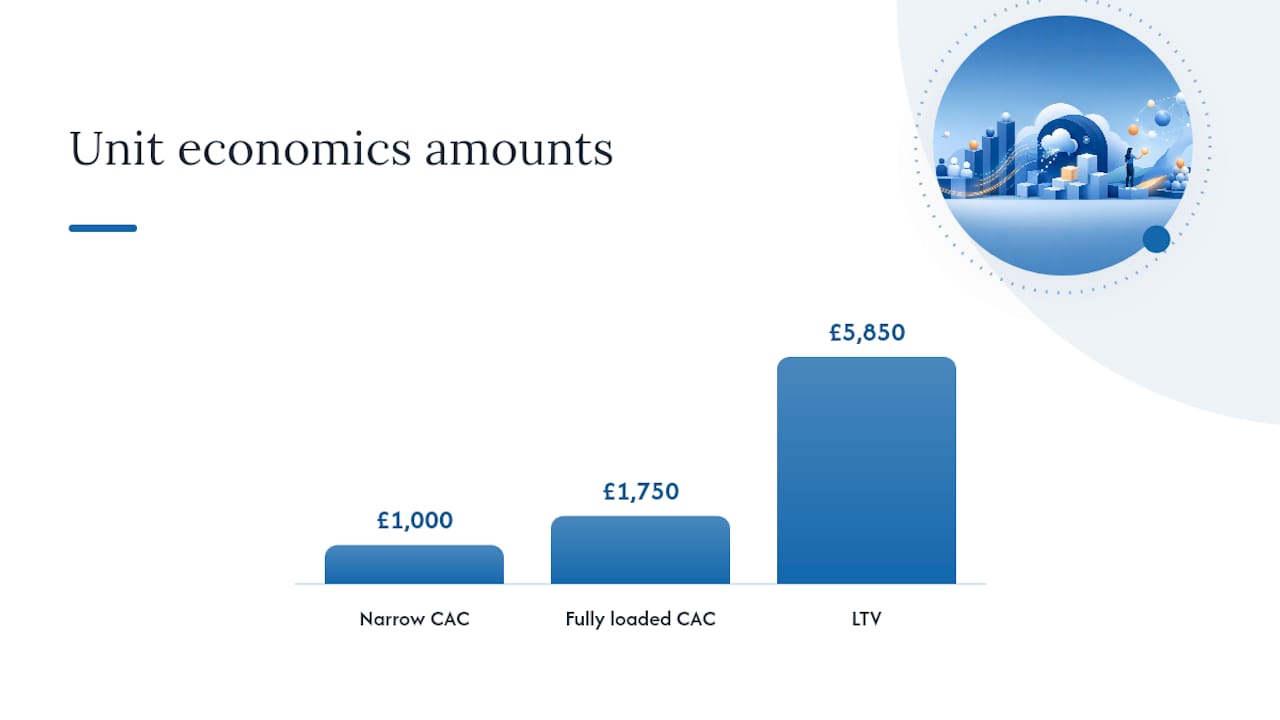
Now the worked example. Say a SaaS company spends £40,000 on paid marketing and £20,000 on sales commissions in a quarter, acquiring 40 new customers. A narrow, “marketing-only” CAC calculation gives you £40,000 ÷ 40 = £1,000 per customer. That number looks good in a pitch deck and is quietly misleading.
Statistic in focus: fully loaded CAC should include sales salaries, onboarding costs, and trial infrastructure, not just ad spend, according to Dual Entry’s CFO framework.
Now run LTV. ARPU is £150/month, gross margin is 78%, and monthly churn is 2%. LTV = (£150 × 0.78) ÷ 0.02 = £5,850. Using the narrow CAC, LTV:CAC is around 5.85:1, which is above typical benchmarks. Using fully loaded CAC, it drops to about 3.34:1, still generally considered healthy, but telling a different story for a board deck.
CAC payback tells the cash story. With fully loaded CAC of £1,750 and monthly gross profit of £117 (£150 × 0.78), payback is approximately 15 months, which falls within commonly cited acceptable ranges but is longer than the sub-12-month mark that is often linked to greater capital efficiency.
Two pitfalls recur constantly. First, calculating LTV against revenue instead of gross profit, which inflates the number and makes weak unit economics look strong. Second, blending CAC across a mixed go-to-market motion, product-led growth alongside enterprise sales, when the two channels have wildly different cost structures and payback profiles. Blend them and you get a number that describes neither channel accurately.
Benchmarks aren’t fixed. They shift with ARR stage and with go-to-market motion, and treating a Seed-stage PLG product against Series B enterprise benchmarks will lead you to the wrong conclusions.
Common red flags, and what they usually mean: an LTV:CAC ratio under 1:1 signals you’re losing money on every customer, full stop, regardless of growth rate. CAC payback periods that extend beyond typical ranges without justification by high NRR may indicate inefficiencies in acquisition channels or pricing issues. Gross margin below about 60% in a pure software business typically signals cost structure issues such as high infrastructure expenses or excessive manual service labor. At later stages, some founders also check the Rule of 40, where growth rate plus profit margin should sum to 40 or above, as a single sanity check on whether growth is coming at a sustainable cost.
Retention comes first, before acquisition tweaks, before pricing changes, because it compounds. A move from 2% to 1.5% monthly churn doesn’t look dramatic on a slide, but it extends average customer lifespan from 50 months to 67 months, and LTV rises by a third with no change to ARPU or CAC. Retention is the single most destructive or constructive force in SaaS unit economics, and it’s the lever most founders underweight because it’s less visible than a new campaign launch.

Pro Tip: *Before touching your acquisition channels, model what a one-point reduction in monthly churn does to LTV.
With retention addressed, work through the remaining levers in rough order of leverage:
Retention tactics deserve particular attention because they’re often cheaper to execute than acquisition fixes. Proven retention strategies tend to centre on proactive customer success outreach timed to usage drop-offs, something most SaaS companies can build without new engineering resource.
A single company-wide LTV:CAC figure hides more than it reveals. Segmenting by cohort is how you find out which parts of the business are actually working.
This is where blended numbers mislead founders most often. A paid search channel might show CAC of £1,200 against an organic channel’s £400, making paid search look inefficient at first glance. Run the cohort analysis and you might find paid search customers have double the NRR of organic ones, because the channel attracts a better-fit customer who expands faster. The higher-CAC channel ends up with a superior LTV:CAC once you follow the cohort rather than the average. A SaaS metrics dashboard built around cohort views, rather than trailing twelve-month averages, is what catches this before a board meeting does.
An accountant filing your VAT return isn’t equipped to build this. An outsourced finance director should be. Here’s what a proper engagement produces.
With extensive combined accounting expertise and experience working with startups, the team has built these models for founders who needed investor-ready numbers on a tight timeline. In a discovery call, ask direct questions: how is CAC loaded, how often is the cohort dashboard refreshed, and how does the model handle a mixed PLG and sales-led motion without blending the two into a misleading average.
Founders and investors read the same metrics differently, and conflating the two readings causes real damage. A founder trying to survive eighteen months of runway should tolerate a longer CAC payback if it buys market share cheaply; an investor doing diligence weeks before a term sheet wants payback tight and auditable, because payback uses current, observable cash data rather than projected LTV, which is precisely why it gets more diligence weight than LTV:CAC.
The trade-off worth naming plainly: chase growth at the expense of payback only when you have the runway to absorb it and a clear reason to believe the market window is closing. Otherwise, tighten first. A one-week move worth making now: pull your fully loaded CAC, cohort your last six months of customers by acquisition channel, and see which channel your gut has been wrong about.
— Rahamut
Most founders discover their CAC was understated the hard way, in a diligence call, when an investor asks why sales salaries weren’t in the model. Priceandaccountants builds the fully loaded numbers before that conversation happens, not during it.

As a finance service provider for UK tech and fintech startups, the company builds fully loaded CAC models, cohort LTV dashboards, and CAC payback scenarios tied directly to your runway, work that sits alongside SaaS revenue recognition support so your ARR figures hold up under investor scrutiny. Where R&D activity is part of your product build, R&D tax credit claims can free up non-dilutive cash that directly improves your payback math. If you’re heading into a funding round or simply want numbers you can defend in a board meeting, book a discovery call and bring your current CAC and churn figures; the model built from there is the one you’ll actually use.
This article is general information, not a substitute for advice from a qualified financial advisor. Consult a qualified financial professional about your own circumstances before acting on anything here.
It’s a framework describing SaaS growth phases: roughly three years of tripling revenue followed by years of doubling, though founders should treat it as a rough growth narrative rather than a target, since unit economics matter more than growth rate alone.
The Rule of 40 states that revenue growth rate plus profit margin should equal or exceed 40, used as a high-level health check at later stages when growth alone no longer tells the full story.
CAC, LTV, LTV:CAC ratio, CAC payback period, gross margin, churn, and NRR are the core examples; each measures a different dimension of whether a single customer relationship is profitable and durable.
There’s no single fixed figure, since EBITDA expectations vary enormously by growth stage and reinvestment strategy; earlier-stage companies often run negative EBITDA deliberately while prioritising growth, whereas mature SaaS businesses are frequently judged more on the Rule of 40 than on EBITDA margin in isolation.
Fully loaded CAC includes sales salaries, onboarding costs, and trial infrastructure alongside marketing spend, and typically produces a noticeably higher figure than a marketing-only calculation, which is why Priceandaccountants builds the fully loaded version before any investor conversation.